Building Decision Tree
Decision Tree
The decision tree model learns a series of questions to infer the class labels of the samples.
The goal of a decision tree algorithm is to find the best split at each node to minimize the impurity of the resulting child nodes.
Gini impurity, entropy, and classification error are three common measures of impurity or uncertainty used in decision trees to select the best split.
Gini impurity measures the probability of a randomly chosen sample being mislabeled if it were randomly labelled according to the distribution of labels in the node.
Entropy measures the amount of disorder or uncertainty in the node.
Classification error measures the proportion of misclassified samples in the node.
Building Decision Tree
from sklearn import datasets
from sklearn.model_selection import train_test_split
from sklearn.tree import DecisionTreeClassifier
import numpy as np

# load iris data
iris = datasets.load_iris()
X = iris.data[:, [2,3]]
y = iris.target

# split training/test data set
X_train, X_test, y_train, y_test = train_test_split(X, y, test_size=0.3, random_state=1, stratify=y)

# training with decision tree classifier
tree = DecisionTreeClassifier(criterion='gini',
                              max_depth=4,
                              random_state=1)
tree.fit(X_train, y_train)
# plot
X_combined = np.vstack((X_train, X_test))
y_combined = np.hstack((y_train, y_test))
plot_decision_regions(X_combined,
                      y_combined,
                      classifier=tree,
                      test_idx=range(105,150))
plt.xlabel('petal length [cm]')
plt.ylabel('petal width [cm]')
plt.legend(loc='upper left')
plt.show()
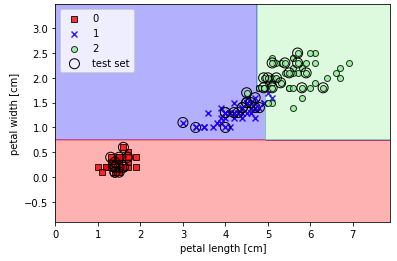
- Plot Result:
from pydotplus import graph_from_dot_data
from sklearn.tree import export_graphviz

dot_data = export_graphviz(tree,
                           filled=True,
                           rounded=True,
                           class_names=['Setosa',
                                        'Versicolor',
                                        'Virginica'],
                           feature_names=['petal length',
                                          'petal width'],
                           out_file=None)
graph = graph_from_dot_data(dot_data)
graph.write_png('tree.png')
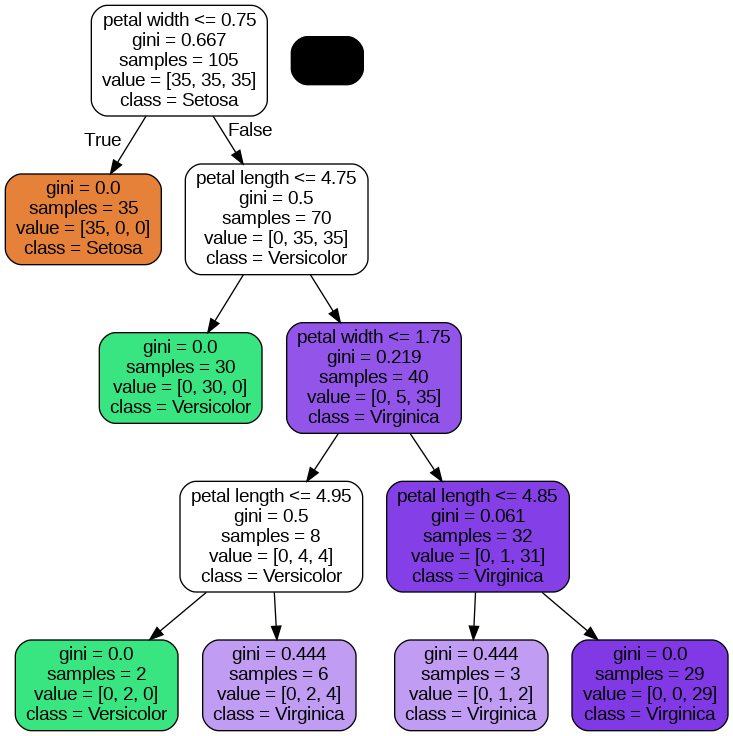
- graphviz Result:
Reference
from 'Python Machine Learning' by Sebastian Raschka, Vahid Mirjalili
Link: rasbt/python-machine-learning-book-2nd-edition · GitHub (github.com)


