Random Forest

Random forest is a popular machine learning algorithm used for classification, regression, and other tasks. It is an ensemble learning method that combines multiple decision trees to create a "forest" of trees. Each decision tree in the forest is trained on a randomly sampled subset of the training data, and the final predictions are made by aggregating the predictions of all the trees in the forest.
The process of building a random forest involves the following steps:
A random subset of the training data is selected, with replacement, to train each decision tree in the forest.
A decision tree is built using the selected subset of data, using a randomly selected subset of features at each split.
Steps 1 and 2 are repeated to build multiple decision trees.
When predicting for a new instance, each decision tree in the forest makes a prediction, and the final prediction is made by aggregating the predictions of all the trees. For classification problems, the class with the most votes is selected, and for regression problems, the average of the predicted values is taken.
Random forest has several advantages over other machine learning algorithms, including:
It is less prone to overfitting compared to a single decision tree.
It can handle large datasets with high dimensionality.
It can handle both categorical and numerical features.
It is a powerful algorithm that performs well on a wide range of problems, without requiring extensive hyperparameter tuning.
Random forest is widely used in practice, including in applications such as image classification, fraud detection, and medical diagnosis.
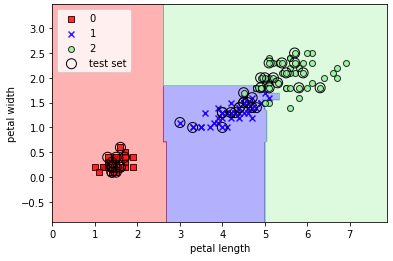
from sklearn.ensemble import RandomForestClassifier

forest = RandomForestClassifier(criterion='gini',
                                n_estimators=25,
                                random_state=1,
                                n_jobs=2)
forest.fit(X_train, y_train)
plot_decision_regions(X_combined, y_combined,
                      classifier=forest,
                      test_idx=range(105,150))

plt.xlabel('petal length')
plt.ylabel('petal width')
plt.legend(loc='upper left')
plt.show()